
Product updates often focus on eye-catching new features. Gravity has launched a few of these recently, including new AI tools for sustainability reporting.
But it’s often more humble features that make software great. Many of the most meaningful updates are improvements to automate a manual task, make an interface more intuitive, or view data in a new way. Gravity obsesses over these improvements, shipping new features every day to make using the platform easier, faster, and sometimes even fun.
This month’s update highlights some of the more understated features Gravity has released recently to detect anomalies, automate data management, and more.
Keep Data Healthy with Built-in Anomaly Detection
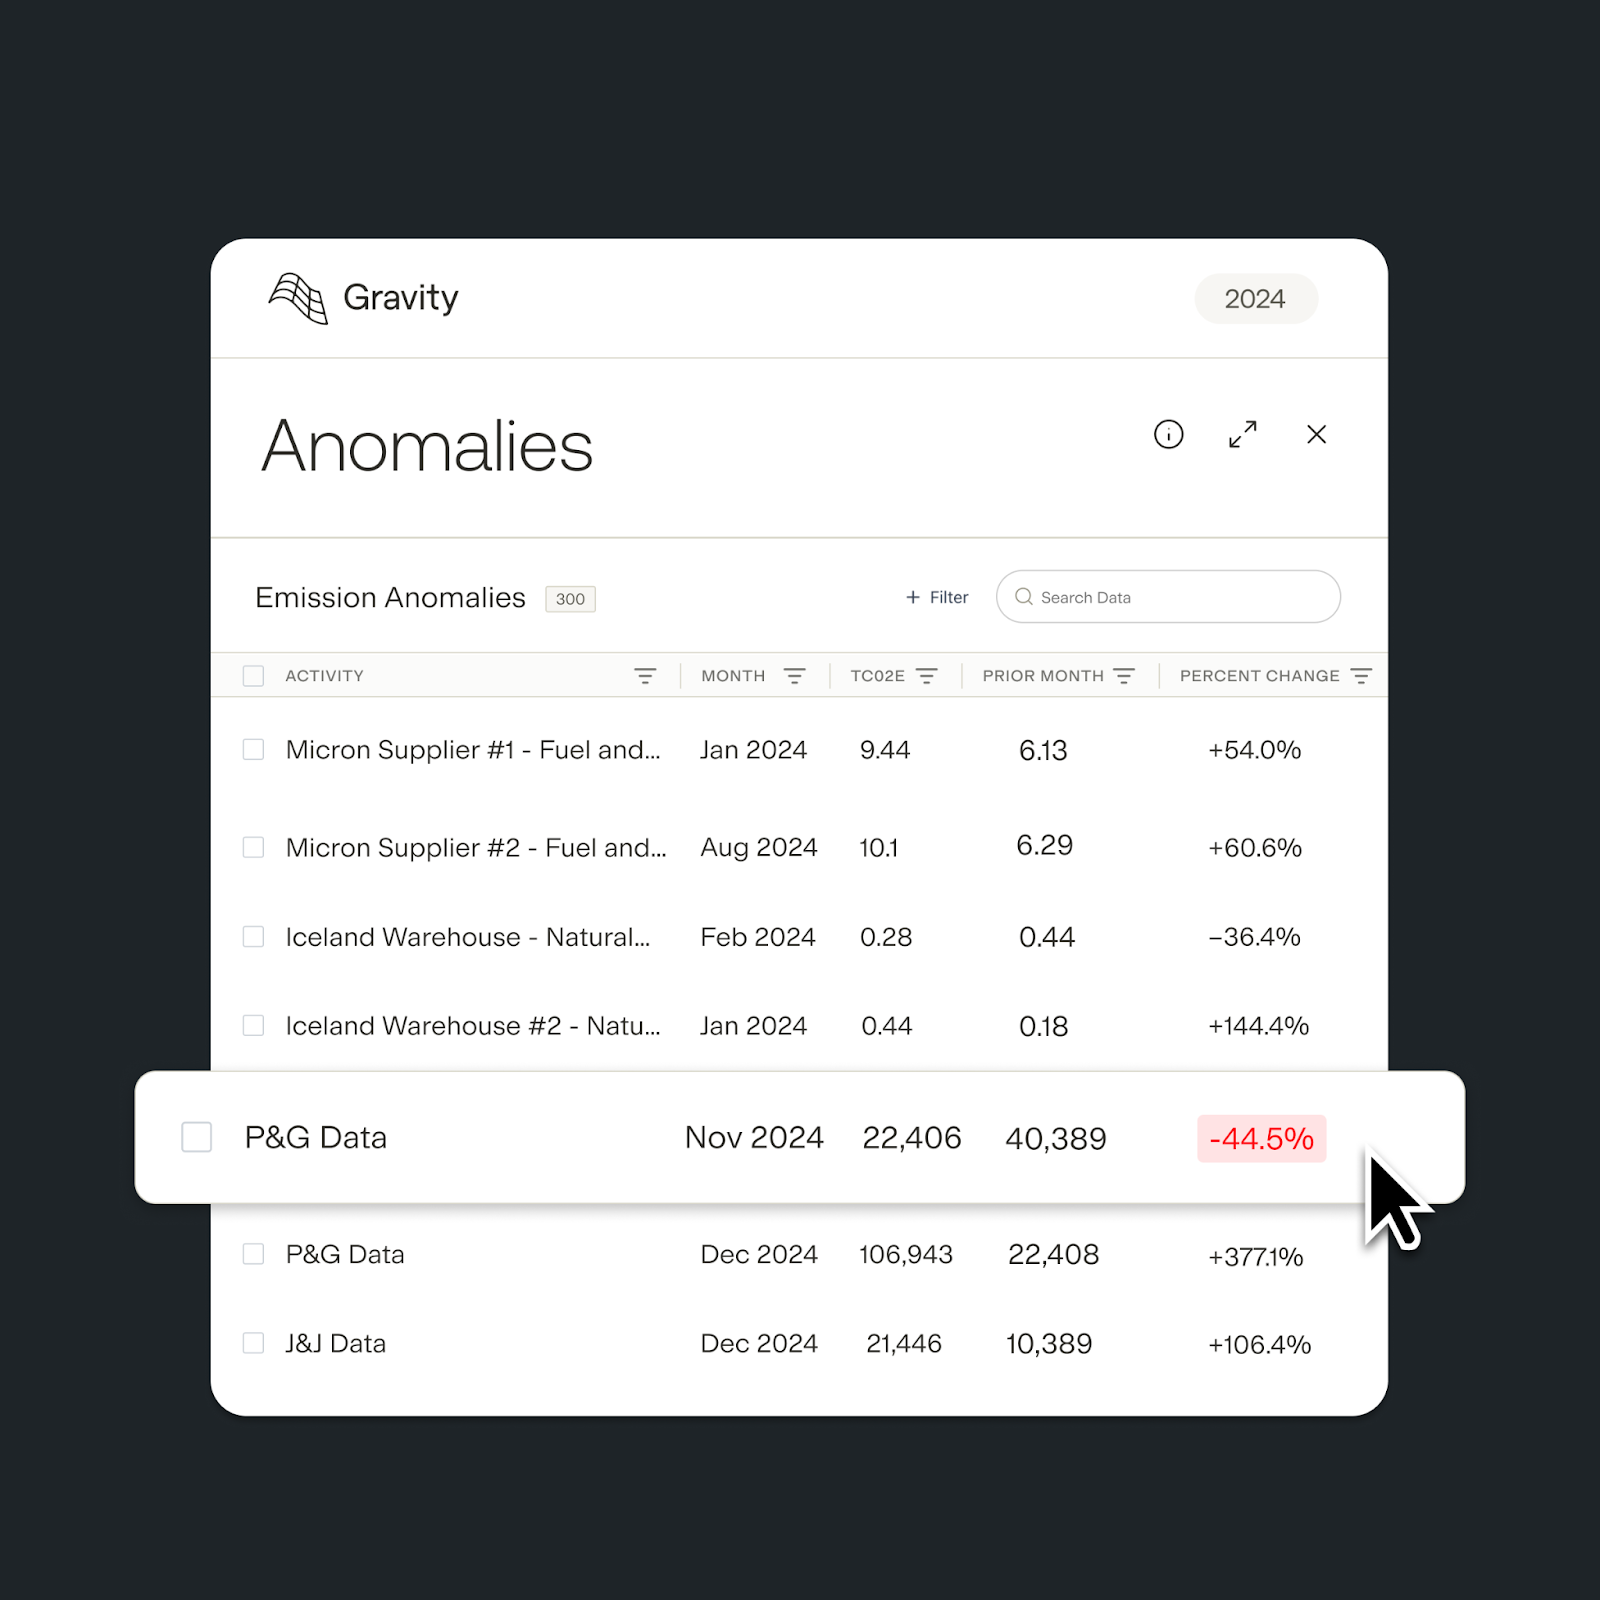
Data errors and unexpected trends are often spotted just before an audit or reporting deadline, leading to painful data cleaning and missed opportunities to reduce emissions. Gravity’s new anomaly detection features help users avoid surprises by identifying issues and new trends as data is ingested:
- Catch emissions spikes, drops, and potential data issues quickly in the Anomalies tab, which normalizes data over time and highlights values that have changed significantly from the previous month or year
- Focus on the most important outliers by searching, sorting, and filtering data using descriptions and absolute or percentage changes in emissions
- Identify incorrectly tagged data across sites by adding operational dates for each site, automatically flagging any data outside the specified range
Automate Data Management for Sites, Fleets, Logistics, and Commuting
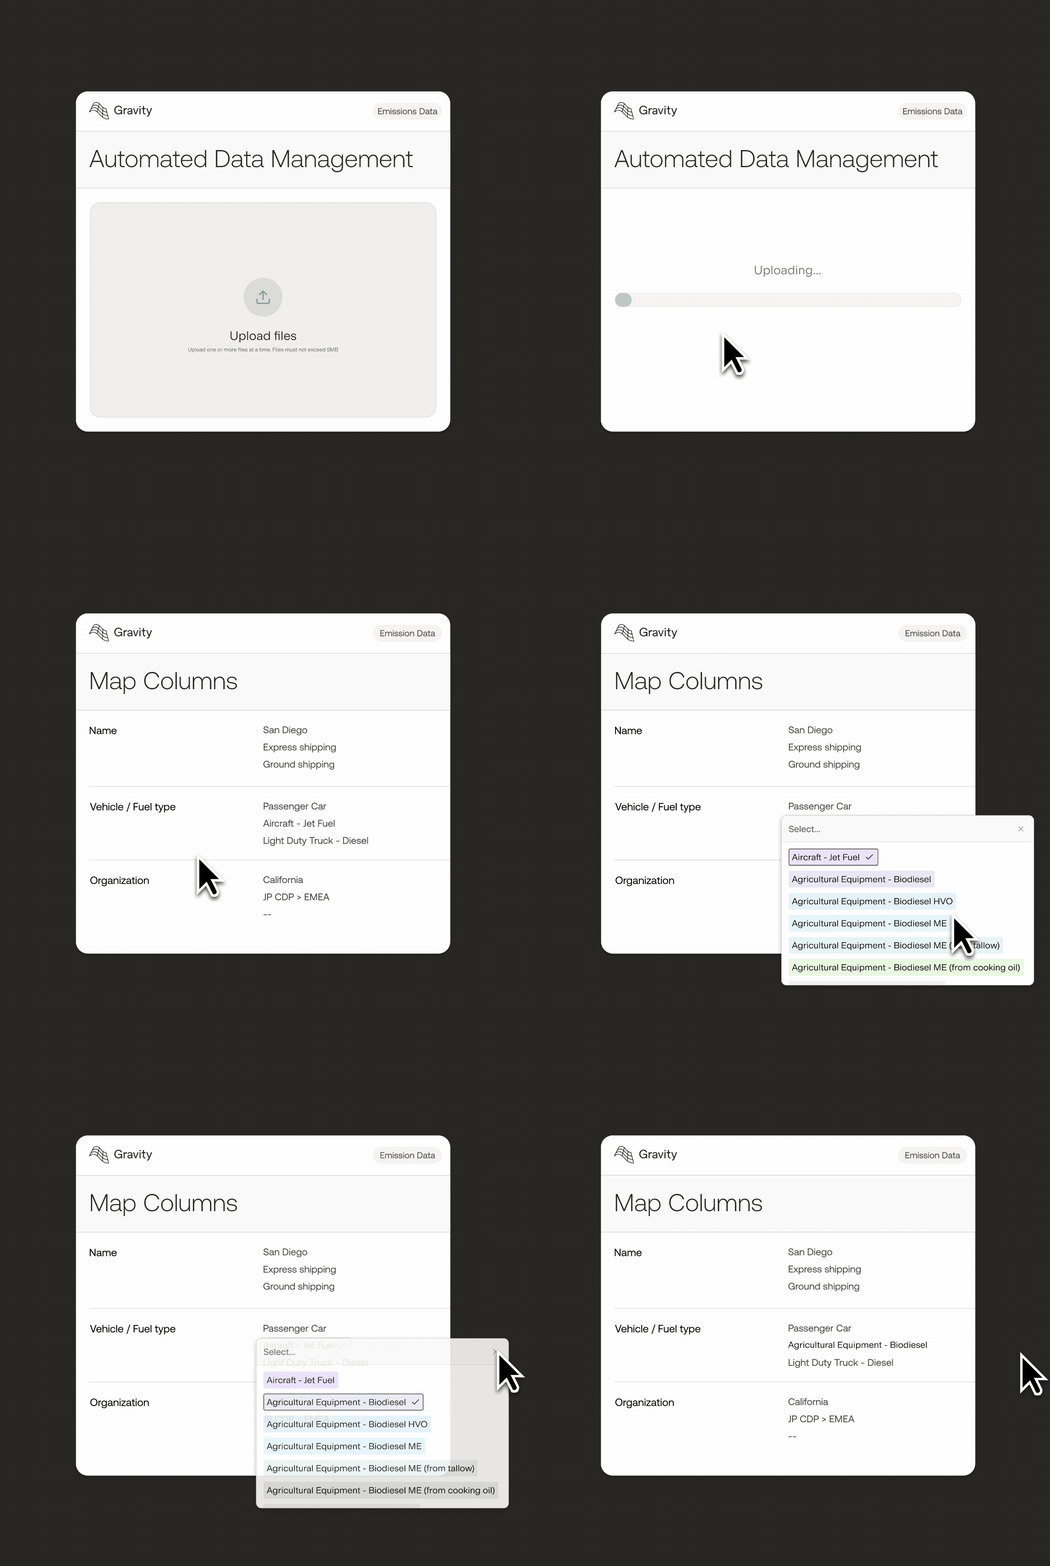
Carbon accounting math is fairly simple, mostly multiplication and addition. Ensuring accurate, consistent, and correctly attributed accounting across hundreds or thousands of sites, fleets, suppliers, and employees, however, is a challenge. Gravity’s new bulk data management features support carbon accounting at scale:
- Manage emissions across complex operations with bulk imports of new sites and fleets plus default tags, which automatically apply to associated activity data for consistent accounting
- Simplify transportation and distribution emissions calculations (Scope 3 Category 4) with automated processing of mass-over-distance logistics data from suppliers and transportation and distribution providers
- Streamline employee commuting emissions calculations (Scope 3 Category 7) with automatic distance calculation, round trip multipliers, invalid address identification, and emissions factor assignment for point-to-point commuting data
What Else is New
- More Explainable Activity Calculations: Users and auditors can now click “Show Calculation” for each row of activity data to see an explanation, including emissions factor selection and unit conversion.
- Data Request Enhancements: Users sending a data request can now copy in additional contacts for more visibility and collaboration, as well as control which questions are shown in data requests based on previous responses.
- Map View: Users can now view site locations as a pin map in Dashboards and browse all of their sites using the map view in Measure.
- Advanced Analysis Enhancements: The Advanced View tab now includes columns for creation date, date of last update, site, source file, and more.
- PDF Exports: Users can now export PDFs for each report directly from the Gravity platform in the Analyze tab.